Messenger
Seamless communication, anywhere. Connecting business and friendly ties effortlessly.

Rooms
Private chats, a secure haven for teams to collaborate.

Inquiries
Online surveys and tests, effortlessly simple with high accuracy.

Database
ffortlessly organize and access your data.

Commerce
Unlock borderless business with distinctive sales opportunities.

Desk
Effortless task management, seamlessly streamlining your workflow.

Booking
Easy booking, hassle-free planning, seamless execution – Rental and Reserve.

Drive
Cloud space for unlimited storage, effortless file organization, and quick sharing.

Finance
Streamline requests, manage budgets, and automate reporting.

Integration
Explore Integrations. Build with the Yonnect API
Usecases
View All
Businesses
Dashboards for Tracking Progress and Driving Results
Yonnect dashboards are a window into the world of your projects, tasks, and teams. Take your work to the next level with Yonnect's personalized dashboards.1.Basic & advanced reporting 2. No-code customization 3. Make confident decisions 4.easily scale workflows 5.High-level overviews 6.Real-time tracking 7. General and immediate view 8. Quick and effective decisions


Overview
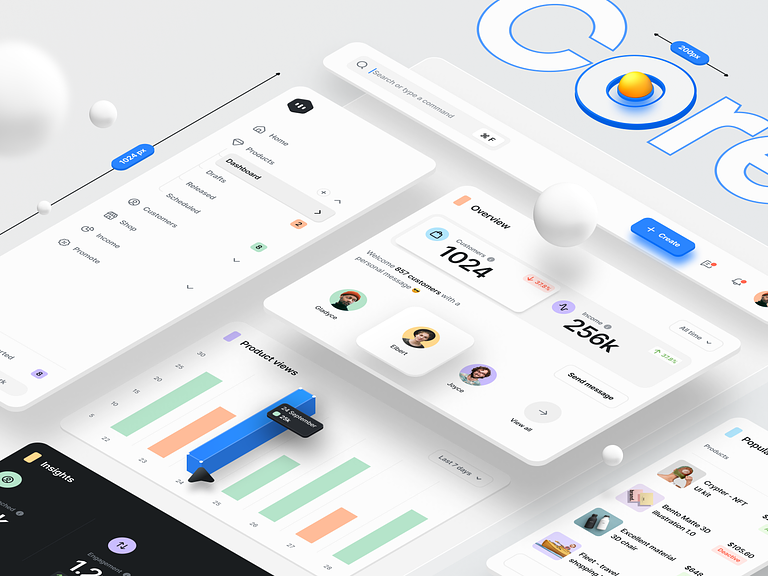
View of Projects and Activities at a Glance
Yonnect dashboards allow you to quickly view the status of projects, tasks, and milestones, enabling efficient decision-making and focus on priorities. Customize dashboards to display critical data, from progress charts to task lists, ensuring you're always updated and managing resources effectively.
- Identify the status of current projects, work progress and upcoming deadlines at a glance.
- In the shortest possible time, have the information you need to make important decisions.
- Optimizing decision-making processes and increasing the efficiency of work teams, with just a few clicks.
- Everything in one place, integrated and manage your activities with ease.
Customization
Custom Dashboards for your Need - Personal and Business
Customize dashboards empowers you to tailor them precisely to your business needs.
Utilize advanced customization tools to incorporate data displays, charts, and analytics specifically aligned with your projects and workflows.
This flexibility enables you to effectively gather, analyze, and present relevant information, facilitating more informed decision-making. Customizing your dashboards in Yonnect is a straightforward and powerful way to enhance the efficiency and productivity of your teams.


Decision-Making
Data Integration for Business Insights
Yonnect dashboards integrate data from a wide range of applets and services, offering a unified view of information in a centralized environment. This feature allows you to collect and display key data from multiple sources on customized dashboards, ensuring all relevant information is automatically updated and accessible without switching between different applications and platforms.
This capability enhances efficient monitoring and management of your business activities and projects.
Analytics
Powerful Analytics and Reports at Your Fingertips
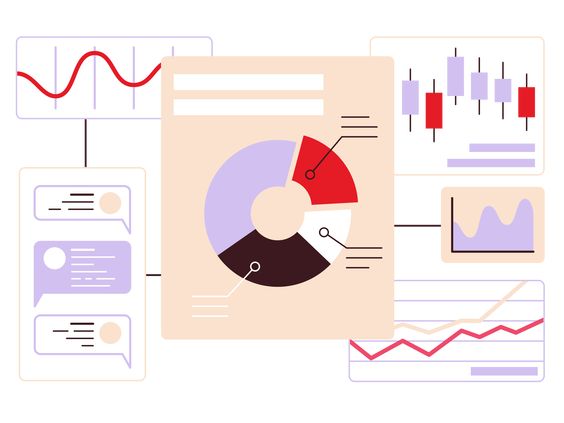
In today's data-driven world, having access to detailed analytics and reports is of utmost importance. By providing advanced analytical capabilities, Yonnect dashboards allow you to accurately monitor the performance of your projects and teams.
By creating useful and understandable reports, you can identify strengths and weaknesses and continuously improve your business processes and strategies.


Collaboration
Shared Dashboards Facilitate Team Collaboration
Teamwork is one of the main success factors.
Yonnect dashboards, with their easy sharing features, create a space for effective team collaboration. By sharing dashboards, team members can see real-time updates and progress on projects, enhancing transparency and boosting internal communications. This not only facilitates better communication but also focuses all members on common goals, from planning and task allocation to progress tracking and outcome reviews.
Shared dashboards in Yonnect are a powerful tool for improving teamwork and efficiency.
Alerts via Dashboard
Notifications Keep Projects on Track
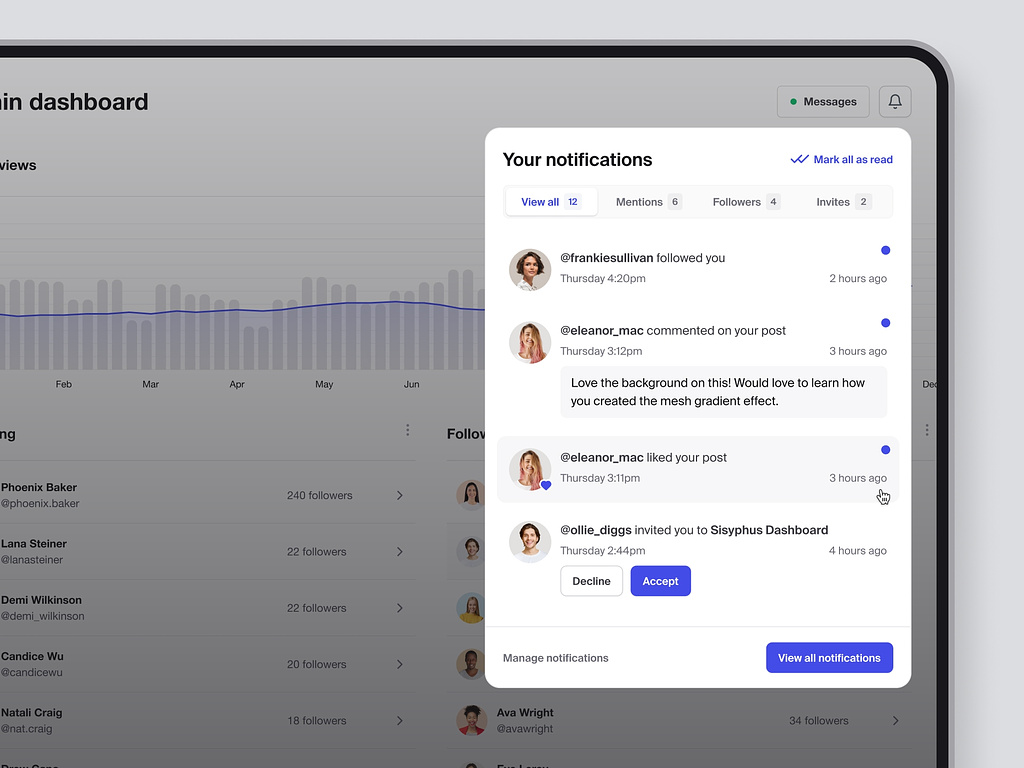
Yonnect dashboard notifications and alerts are crucial tools for maintaining communication and providing instant updates within team and project management. Users can also set custom notifications based on their specific needs, including alerts for upcoming deadlines, task changes, or project progress.
Managing Notifications and Alerts via Dashboard

Views
View Data Your Way
You can display pages and data in different styles. This feature allows you to view and manage your data more effectively. These views give you more flexibility and power in controlling and organizing data and resources.

Three view
Calendar
Boards
Cards
Matrix
Timeline
Table
Pivot
Form
Gantt Chart
Learn How to Use Insight-Driven Dashboards
Track and Analyze Real-Time Progress with Custom Dashboards
Monitor the real progress of your projects in real time and achieve the desired results by using Yonnect dashboards.

Yonnect
The birth of unlimited connections


